The HTTP headers your web server is sending can answer a couple of questions and allow you to quickly diagnose problems.
One way to view HTTP headers is by using your web browser’s Developer Tools or Google Webmaster Tools for your web property. Here is how to do it.
In Google Webmaster Tools, this feature is called Fetch as Google and it allows you to see what’s happening under the hood when the crawler is accessing s particular URI. This method requires you to verify the ownership of your web property and does not support spoofing of the user agent string.
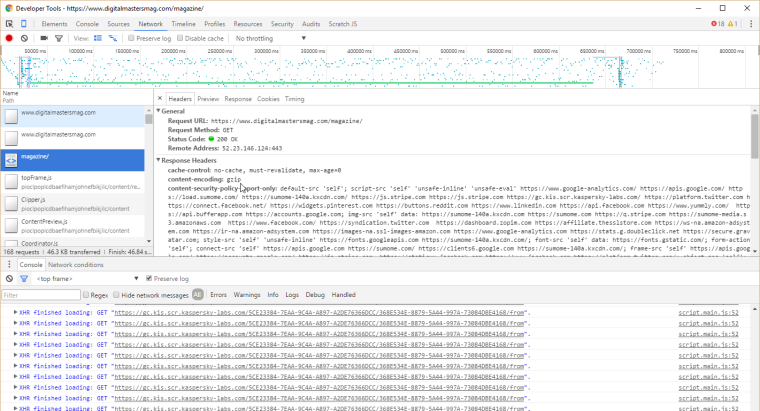
If you need to spoof the user agent string to view the response for a particular device (or if verifying the ownership of your web property is out of the question), you can inspect HTTP headers using the Developer Tools feature of your web browser.
View HTTP headers as Google does in Google Search Console
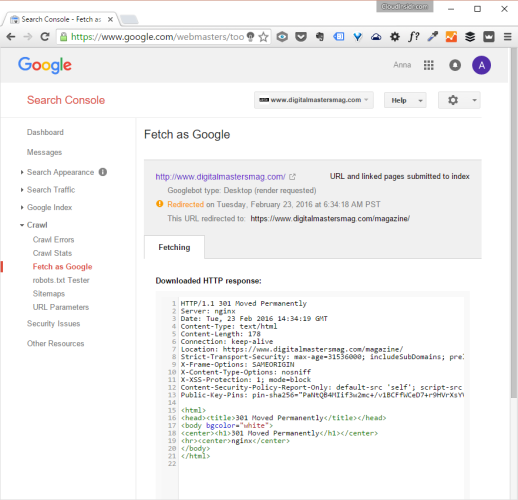
You can conveniently view the HTTP headers in Google Search Console using the Fetch as Google feature.
Step 1. Fetch as Google
In Google Webmaster Tools, navigate to Crawl > Fetch as Google, enter the address of your page, select the device, and hit the Fetch button.
Step 2. View the HTTP response
Click on the >> symbol to view the HTTP response of your web server, beginning with the HTTP headers, followed by the HTML. For example, for a 301 redirect, you will see something to this effect:
HTTP/1.1 301 Moved Permanently
Server: nginx
Date: Tue, 23 Feb 2016 14:34:19 GMT
Content-Type: text/html
Content-Length: 178
Connection: keep-alive
Location: https://www.digitalmastersmag.com/magazine/
Strict-Transport-Security: max-age=31536000; includeSubDomains; preload
X-Frame-Options: SAMEORIGIN
X-Content-Type-Options: nosniff
X-XSS-Protection: 1; mode=block
Content-Security-Policy-Report-Only: default-src 'self'; [] report-uri https://report-uri.io/report/f454b82e7d32b8566fe5e2c5adce5e2e/reportOnly
Public-Key-Pins: pin-sha256="PaNtQB4MIif3w2mc+/v1BCFfWCeD7+r9HVrXsYVIdjI="; pin-sha256="v9CghcQci1EC30X1Zdc+ORThG4cjqIHqCSZCxb7cZQY="; max-age=3600
<html>
<head><title>301 Moved Permanently</title></head>
<body bgcolor="white">
<center><h1>301 Moved Permanently</h1></center>
<hr><center>nginx</center>
</body>
</html>

This is how a successful response may look like:
HTTP/1.1 200 OK
Server: nginx
Date: Tue, 23 Feb 2016 22:34:55 GMT
Content-Type: text/html; charset=UTF-8
Transfer-Encoding: chunked
Connection: keep-alive
Vary: Accept-Encoding
X-Powered-By: PHP/7.0.3
Link: <https://www.digitalmastersmag.com/magazine/wp-json/>; rel="https://api.w.org/"
Strict-Transport-Security: max-age=31536000; includeSubDomains; preload
X-Frame-Options: SAMEORIGIN
X-Content-Type-Options: nosniff
X-XSS-Protection: 1; mode=block
Content-Security-Policy-Report-Only: default-src 'self'; [more of the policy] ; report-uri https://report-uri.io/report/f454b82e7d32b8566fe5e2c5adce5e2e/reportOnly
Public-Key-Pins: pin-sha256="PaNtQB4MIif3w2mc+/v1BCFfWCeD7+r9HVrXsYVIdjI="; pin-sha256="v9CghcQci1EC30X1Zdc+ORThG4cjqIHqCSZCxb7cZQY="; max-age=3600
<!DOCTYPE html>
[the rest of the markup]
View HTTP headers in your web browser using Developer Tools
In Google Chrome open your page in a browser window, open the Developer Tools panel, navigate to the Network tab, find the web resource you want to inspect and click on the Headers tab to view your web server’s response.

At this time it sounds like Drupal is the best blogging platform out
there right now. (from what I’ve read) Is that what you are
using on your blog?
Thank you. Please come back for more.